Your CPC Isn't the Problem You Think it is
Every B2B SaaS marketer has had this moment: LinkedIn CPC comes in at $11, and the instinct is to panic. Then you learn LinkedIn-sourced deals close 28-35% larger than Google-sourced ones, and the number stops looking scary.
LinkedIn is the most expensive major ad platform, full stop. Average CPC across B2B SaaS in 2026 runs $8-$15, versus $5-$30 for non-brand Google Search terms. The real question isn't whether your CPC beats some generic benchmark. It's whether your cost per SQL and pipeline-to-spend ratio hold up - and you can't answer that by staring at your own dashboard in isolation.
The 2026 LinkedIn Ads Benchmarks, By the Numbers
CPC: $8-$15 average for B2B SaaS. Top quartile accounts achieve $5-$8 through tight ICP targeting and strong Quality Scores. Cybersecurity and fintech run higher, $12-$18. HR tech and manufacturing run lower, $5-$9.
CPL: Lead Gen Form CPL averages $75-$150. Landing page CPL runs higher, $100-$250, because of the extra friction. Top quartile accounts get Lead Gen Form CPL down to $50-$75.
CTR: Median CTR is 0.44% for video, 0.50% for single image, 0.55% for carousel, and 0.62% for document ads. Anything above these medians signals your creative and targeting are outperforming the category average.
Cost per SQL: This is the number that actually matters, and it's the one most benchmarks skip. Agency-managed accounts report $300-$600 per SQL. Industry-wide average sits at $800-$2,000. If your CPL looks fine but your cost per SQL is closer to the industry number than the agency-managed one, your targeting or offer - not your creative - is the problem.
Why Averages Don't Tell You Anything Useful
Here's the problem with every benchmark table, including the one above: it tells you what "average" looks like across hundreds of accounts you've never seen. It doesn't tell you what the three companies actually competing for your buyer's attention are running right now.
Two SaaS companies can both hit a "good" $100 CPL and be in completely different competitive positions. One is running the same generic product ads that their competitor ran eight months ago. The other has already seen that ad, adjusted their offer, and moved on to document ads with 3x the engagement. Averages can't show you which one you are.
What Actually Moves These Numbers
A few patterns show up consistently in accounts that beat category benchmarks:
Layered targeting beyond job titles. Job function plus seniority plus specific skills consistently outperforms broad title-based targeting alone.
Native-feel creative. First-person voice, specific numbers in headlines, and content that looks like it came from a person's feed rather than a brand account drive real CTR lifts.
Document ads for mid-funnel offers. E-books and research reports distributed as document ads routinely show CPL 30-40% lower than the same offer run through a generic Lead Gen Form.
Retargeting built for long B2B cycles. SaaS buying committees don't convert on the first touch. Accounts that build retargeting sequences around the buying cycle length, not a generic 30-day window, see meaningfully better cost-per-SQL numbers.
See What Your Competitors Are Actually Running
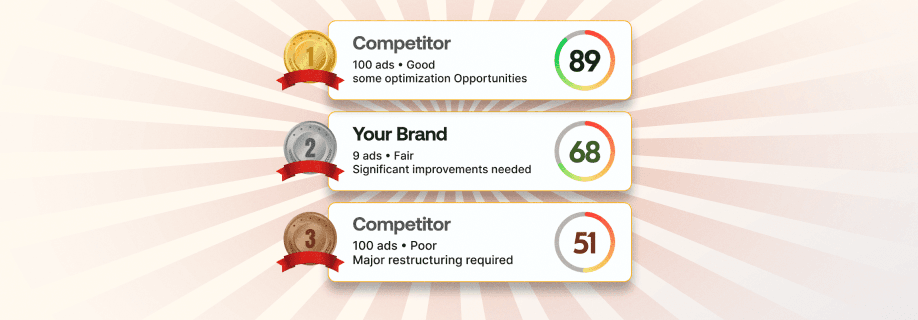
This is exactly the gap our free LinkedIn Ad Library tool closes. Instead of guessing at what "good" looks like from an industry-wide table, you get a live pull of the actual ads your named competitors are running on LinkedIn right now - creative, messaging angle, and format.
Run your competitive report and you'll see:
Which competitors are actively spending on LinkedIn right now, and on what offers
What creative formats they're leaning into - image, video, carousel, or document
How their messaging angle compares to yours on the same buyer pain points
Where the gaps sit - formats or angles nobody in your category is using yet
It takes a few minutes, and it's free. No sales call required to see the data.
How the Yellowkyte’s LinkedIn Ad Library Tool Actually Gets You There
Knowing the benchmarks is step one. Turning that into a better campaign is where most teams stall out, because a number on a page doesn't tell you what to change tomorrow morning. This is the gap the tool is built to close, not just report on.
Here's what it does for you, mapped to the objectives you're actually chasing:
If your objective is lower CPC and CPL: The tool shows you which competitors are targeting the same job titles you are, and what creative angle they're using to earn attention at a lower cost. If three competitors have moved to document ads and you're still running static image creative, that gap is usually your fastest fix - not a targeting overhaul.
If your objective is finding a messaging edge: You see the actual pain points, hooks, and offer types competitors are leading with right now, not a guess based on their website copy. Messaging that's been running for months without a refresh is a signal - either it's working and worth studying, or the competitor has stopped paying attention, and that's an opening.
If your objective is protecting or growing share of voice: The report flags when a competitor increases spend or launches a new campaign, so you're not finding out three months later that they quietly outspent you on your core ICP.
If your objective is validating a new format or channel bet: Before you commit budget to document ads, carousel, or a new offer type, you can check whether it's already proven out in your category or still untested - reducing the guesswork in your next test cycle.
The report is free, and it's built to be a starting point, not a locked-away audit. If the gaps it surfaces are bigger than a same-day creative fix, that's usually the moment to bring in a second set of eyes - which is exactly where our Audit & RCA process picks up.
FAQs
Q1: What's a good LinkedIn CPC for B2B SaaS in 2026?
Average B2B SaaS CPC runs $8-$15. Top-quartile accounts with tight ICP targeting get to $5-$8. Cybersecurity and fintech typically run higher, $12-$18, due to smaller, more competitive audiences.
Q2: Why is my LinkedIn CPL higher than my Google CPL?
LinkedIn CPL runs 2-3x higher than Google Search on average, reflecting the platform's premium professional targeting and smaller inventory. The tradeoff: LinkedIn-sourced deals tend to be 28-35% larger, so a higher CPL doesn't automatically mean worse ROI.
Q3: Should I judge my LinkedIn performance on CPL or cost per SQL?
Cost per SQL. Two campaigns can post identical CPLs and produce very different pipeline outcomes depending on lead quality. A $150 CPL with a 60% sales-accepted rate outperforms a $75 CPL with a 20% sales-accepted rate every time.
Q4: What ad format performs best on LinkedIn for B2B SaaS in 2026?
Document ads currently post the highest CTR ranges (2.0-5.0%) for mid-funnel offers like research reports, and typically deliver CPL 30-40% lower than the same offer through a generic Lead Gen Form - provided the creative reads like native content, not repackaged brand material.
Q5: How do I see what my competitors are running on LinkedIn?
YellowKyte's free LinkedIn Ad Library tool pulls live competitor ad data - creative, format, and messaging - so you can benchmark against what's actually running in your category instead of relying on generic industry averages.