Why Most Marketing Audits Miss the Real Problem
Ask most marketing teams "how's the funnel doing" and you get a traffic number and a leads number. Both go up, everyone's happy. Neither number tells you whether the business is actually growing efficiently, because the leak that kills most B2B SaaS pipelines happens two stages downstream of where teams usually look.
The data is blunt about this: MQL-to-SQL conversion shows a 30+ point spread between bottom-25% and top-10% performers - the single biggest swing factor in the entire funnel, according to Prospeo's 2026 B2B SaaS benchmarks. A company obsessing over visitor-to-lead rate while ignoring this stage is optimizing the wrong lever entirely.
The Five-Layer Audit Framework
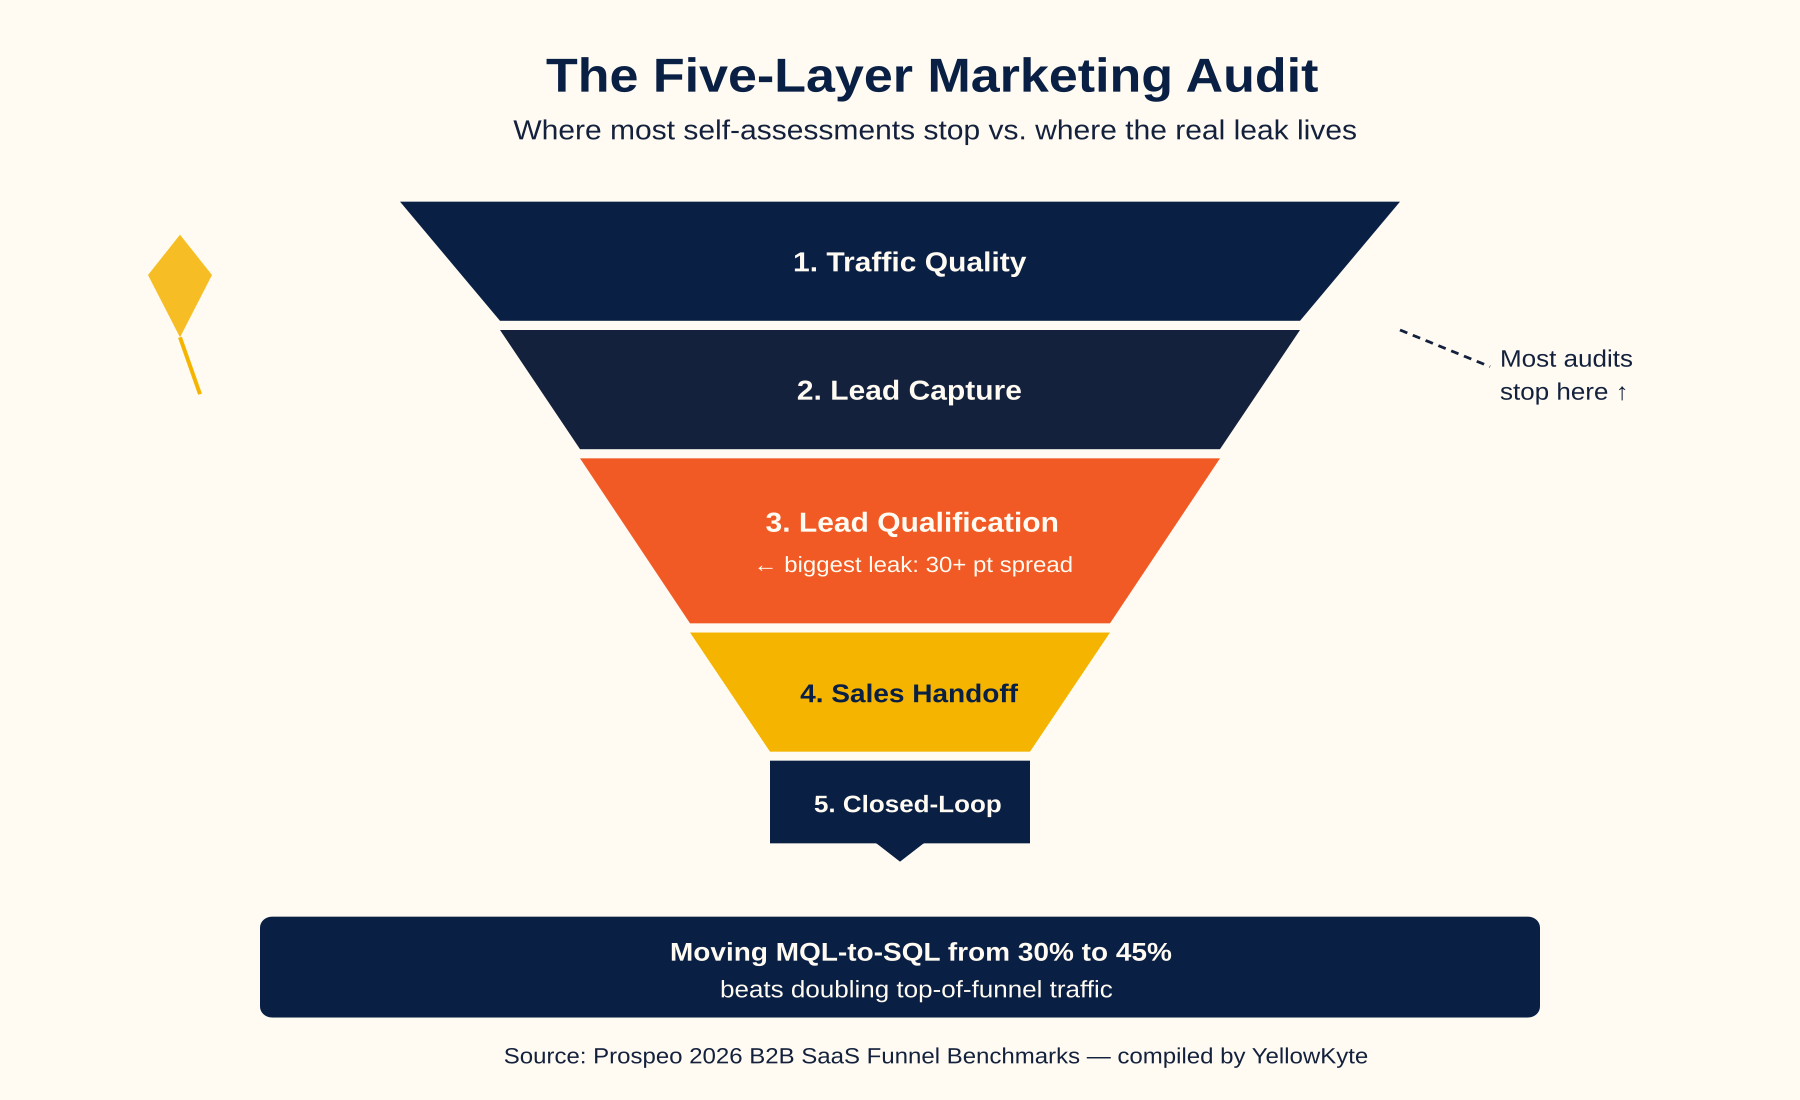
Layer 1: Traffic Quality
Don't just check volume - check where it's coming from and what it converts to downstream. B2B SaaS visitor-to-lead rates average 1.5-2.5%, with SEO at roughly 2.1% and PPC trailing at 0.7%. If your traffic mix is heavily paid and your visitor-to-lead rate sits below 1%, that's not automatically a problem - it depends on whether the downstream MQL-to-SQL rate on that traffic holds up.
Audit questions:
What percentage of total traffic comes from each channel, and does that match where your budget is actually allocated?Is your visitor-to-lead rate benchmarked separately by channel, or blended into one number that hides which channels are actually working?
Layer 2: Lead Capture
Lead-to-MQL rates average 37-41% for B2B SaaS, with real variance by channel - SEO and email typically outperform PPC and LinkedIn here too. A form with too much friction (excessive fields, no clear value exchange) suppresses this number regardless of how good your top-of-funnel traffic is.
Audit questions:
How many fields does your primary lead capture form require, and does each one earn its place?
Is your lead-to-MQL rate tracked by channel and by offer type, or reported as one blended average?
Layer 3: Lead Qualification (The Layer Most Audits Skip)
This is where the real leak lives. Cross-industry MQL-to-SQL averages sit around 15%, while B2B SaaS specifically benchmarks closer to 38-39% when data quality is solid, per 2026 B2B sales funnel research. A wide gap between your number and this benchmark is rarely a "marketing effort" problem - it's usually a data quality or scoring-criteria problem.
Audit questions:
What percentage of your MQLs have bounced or invalid contact information? (20-40% bounce rates are common with unverified data and quietly tank this entire stage.)
Do sales and marketing agree on the MQL definition, or does sales quietly discount marketing's qualified leads before working them?
How fast is a new MQL contacted? Leads contacted within five minutes convert dramatically better than those contacted even an hour later - most teams take 24-48 hours.
Layer 4: Sales Handoff and Pipeline Velocity
SQL-to-Opportunity averages 40-48% in B2B SaaS, and Opportunity-to-Close averages 31-39%. Sales cycle length varies enormously by deal size - median 84 days overall, but SMB deals close in 14-30 days while enterprise deals run 90-180+ days, with negotiation and procurement eating 35-40% of enterprise cycle time.
Audit questions:
Is your reported sales cycle length segmented by deal size, or is one blended number hiding wildly different realities across your pipeline?
Where in the cycle do deals actually stall - discovery, proposal, or negotiation? Most teams assume it's early-stage indecision when the real bottleneck is late-stage procurement.
Layer 5: Closed-Loop Reporting
The layer that ties everything together - and the one most self-assessments never reach. Without closed-loop attribution from first touch through closed revenue, every metric above is a guess dressed up as data.
Audit questions:
Can you trace a closed deal back to its original marketing touchpoint, or does attribution break somewhere in the CRM handoff?
Are you tracking 5-7 core metrics reviewed weekly, or a 20-metric dashboard nobody actually opens?
Where YellowKyte Fits in Solving What the Audit Finds
Running this checklist is genuinely useful on its own - most teams that go through it honestly find their real leak isn't where they assumed. Where it gets harder is fixing what you find, especially Layer 3 and Layer 5, which usually require both a data quality fix and a genuine sales-marketing alignment conversation, not just a marketing tactic swap.
This is exactly what our Audit & RCA process is built to do first - before any strategy gets proposed, we run this same five-layer diagnostic against your actual funnel data, not a generic benchmark comparison. Combined with MarkOps & Automations, we can fix the data quality and attribution gaps that usually sit underneath a weak MQL-to-SQL number, not just optimize the top-of-funnel channels that are easier to point to. The 3-month proof-of-concept means you see whether the fix actually moves the number before committing further.
How Often Should You Run This Audit?
Quarterly, not annually. Channel benchmarks, buyer behavior, and your own team's execution quality shift meaningfully within a quarter - an annual audit is diagnosing a funnel that no longer exists by the time you act on the findings. Set a recurring 90-day review against this same five-layer framework so you're comparing your own trend line, not just a static external benchmark.
FAQs
Q1: What's the single most important metric to audit first?
MQL-to-SQL conversion. It shows the widest performance spread between weak and strong companies (30+ points), and improves its compounds through every downstream stage more than any top-of-funnel improvement can.
Q2: How often should a B2B SaaS company run a full marketing audit?
Quarterly. Funnel benchmarks and channel performance shift enough within 90 days that an annual audit is already outdated by the time findings turn into action.
Q3: Why does blending PPC and SEO performance into one metric cause bad decisions?
Because the channels convert at meaningfully different rates downstream - SEO's 51% MQL-to-SQL versus PPC's 26% means a blended "cost per lead" number systematically over-credits paid spend and under-credits organic performance.
Q4: What causes most MQL-to-SQL leakage?
Data quality issues (bounced or invalid contact information at 20-40% rates) and misaligned MQL definitions between sales and marketing are the two most common causes - more often than genuine lack of buyer interest.
Q5: What's a realistic B2B SaaS sales cycle length to benchmark against?
Median is 84 days overall, but this varies hugely by deal size: 14-30 days for SMB deals under $15K, 30-60 days for mid-market ($15-50K), and 90-180+ days for enterprise deals over $100K. Always segment by ACV before comparing your own cycle length.